


Clever Point and Figure Charts app for iPhone and iPad
Developer: CleverInfo
First release : 01 Aug 2012
App size: 24.64 Mb
Improve your stock trading by using the proven method of Point & Figure Charting and Portfolio Performance Tracking. Now on iPhones and iPads.
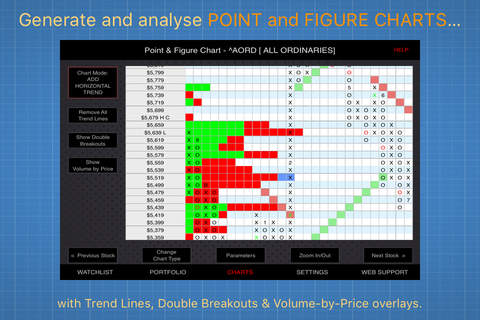
Point and Figure Charts (sometimes referred to as P&F charts) offer a great way to see the rising and falling trends in a stock and its resistance and support levels. In addition, P&F charts allow you to easily pinpoint buy and sell points as well as target prices and stop losses.
Clever Point and Figure Charts (this app) will do all the hard work for you by drawing the charts and allowing you to easily analyse opportunities over time.
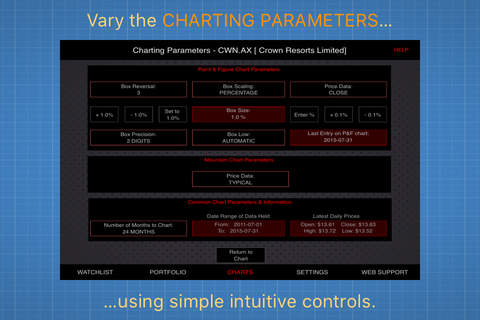
• Providing flexible Point and Figure Charting. We have included a wide range of parameters that you can tweak for each stock including the number of boxes in a reversal, the size of the boxes (by %, set amount or standard boxes) and whether to use Close, Adjusted Close or High/Low prices. Each chart is scrollable and easy to view irrespective of the size of the chart.
• Use Mountain Charts to provide context to the Point and Figure charts.
• Display intuitive Portfolio charts showing how your purchased stocks are performing relative to up to 3 user definable Profit Targets and a Stop Loss.
• Drawing Analysis Lines. Point and Figure charts are excellent for understanding trends, support and resistance lines and good times to buy and sell. The app lets you add multiple horizontal lines and rising or falling trend lines on top of your Point and Figure chart to help with your analysis.
• Identify and display on the chart the Double Top / Bottom Breakouts to help your analysis.
• Display a Volume-By-Prive overlay on your Point and Figure Chart.
• Latest close price and high/low range indicated on the chart to improve your analysis even further.
• Displays your Watchlist and Portfolio as a Heat Map. Your stocks are displayed on a auto-scaling heat map. The colours of each stock box is determined by the last change in close price (Watchlist) or the overall change in your holding (Portfolio). Click a watchlist stock to view the Point and Figure chart or one from your Portfolio to see the performance chart. Then move backwards or forwards through the charts for all your stocks.
• Worldwide Stock and Index coverage. All data is sourced from Yahoo finance. If Yahoo has historical data for your item of interest, then Clever Point and Figure Charts can chart it. NOTE: it appears that Yahoo no longer support the downloading of FOREX data of the form EURUSD=X etc. As such, you cannot use this app to analyse this type of symbol.
Latest reviews of Clever Point and Figure Charts app for iPhone and iPad
If you are a point and figure chartist this app is reason enough to buy an iPad. I have relied on point and figure charts since I entered the business in 1984 and have used most of the PnF software available. It is hard enough to find a good PnF charting package in any format. It is great to find one that works so well on the iPad. This isnt perfect but it provides solid technical analysis. I would like to see PnF relative strength charts added, and in a perfect world real time charts.
This is a nice intuitive app for generating P&F charts on your IOS device. The ability to set box size and reversal size is very handy and those in need of a P&F charting package will find this app very useful. I wish the single box reversal were implemented per Wychoffs rules. If it were, I would have given this app 5 Stars. Enjoy!